
Every session of a test campaign, on one dashboard.
Pass rates, route coverage, compatibility by operator and charger, and open issues. For the whole programme, one market or one vehicle, while the campaign is still running.
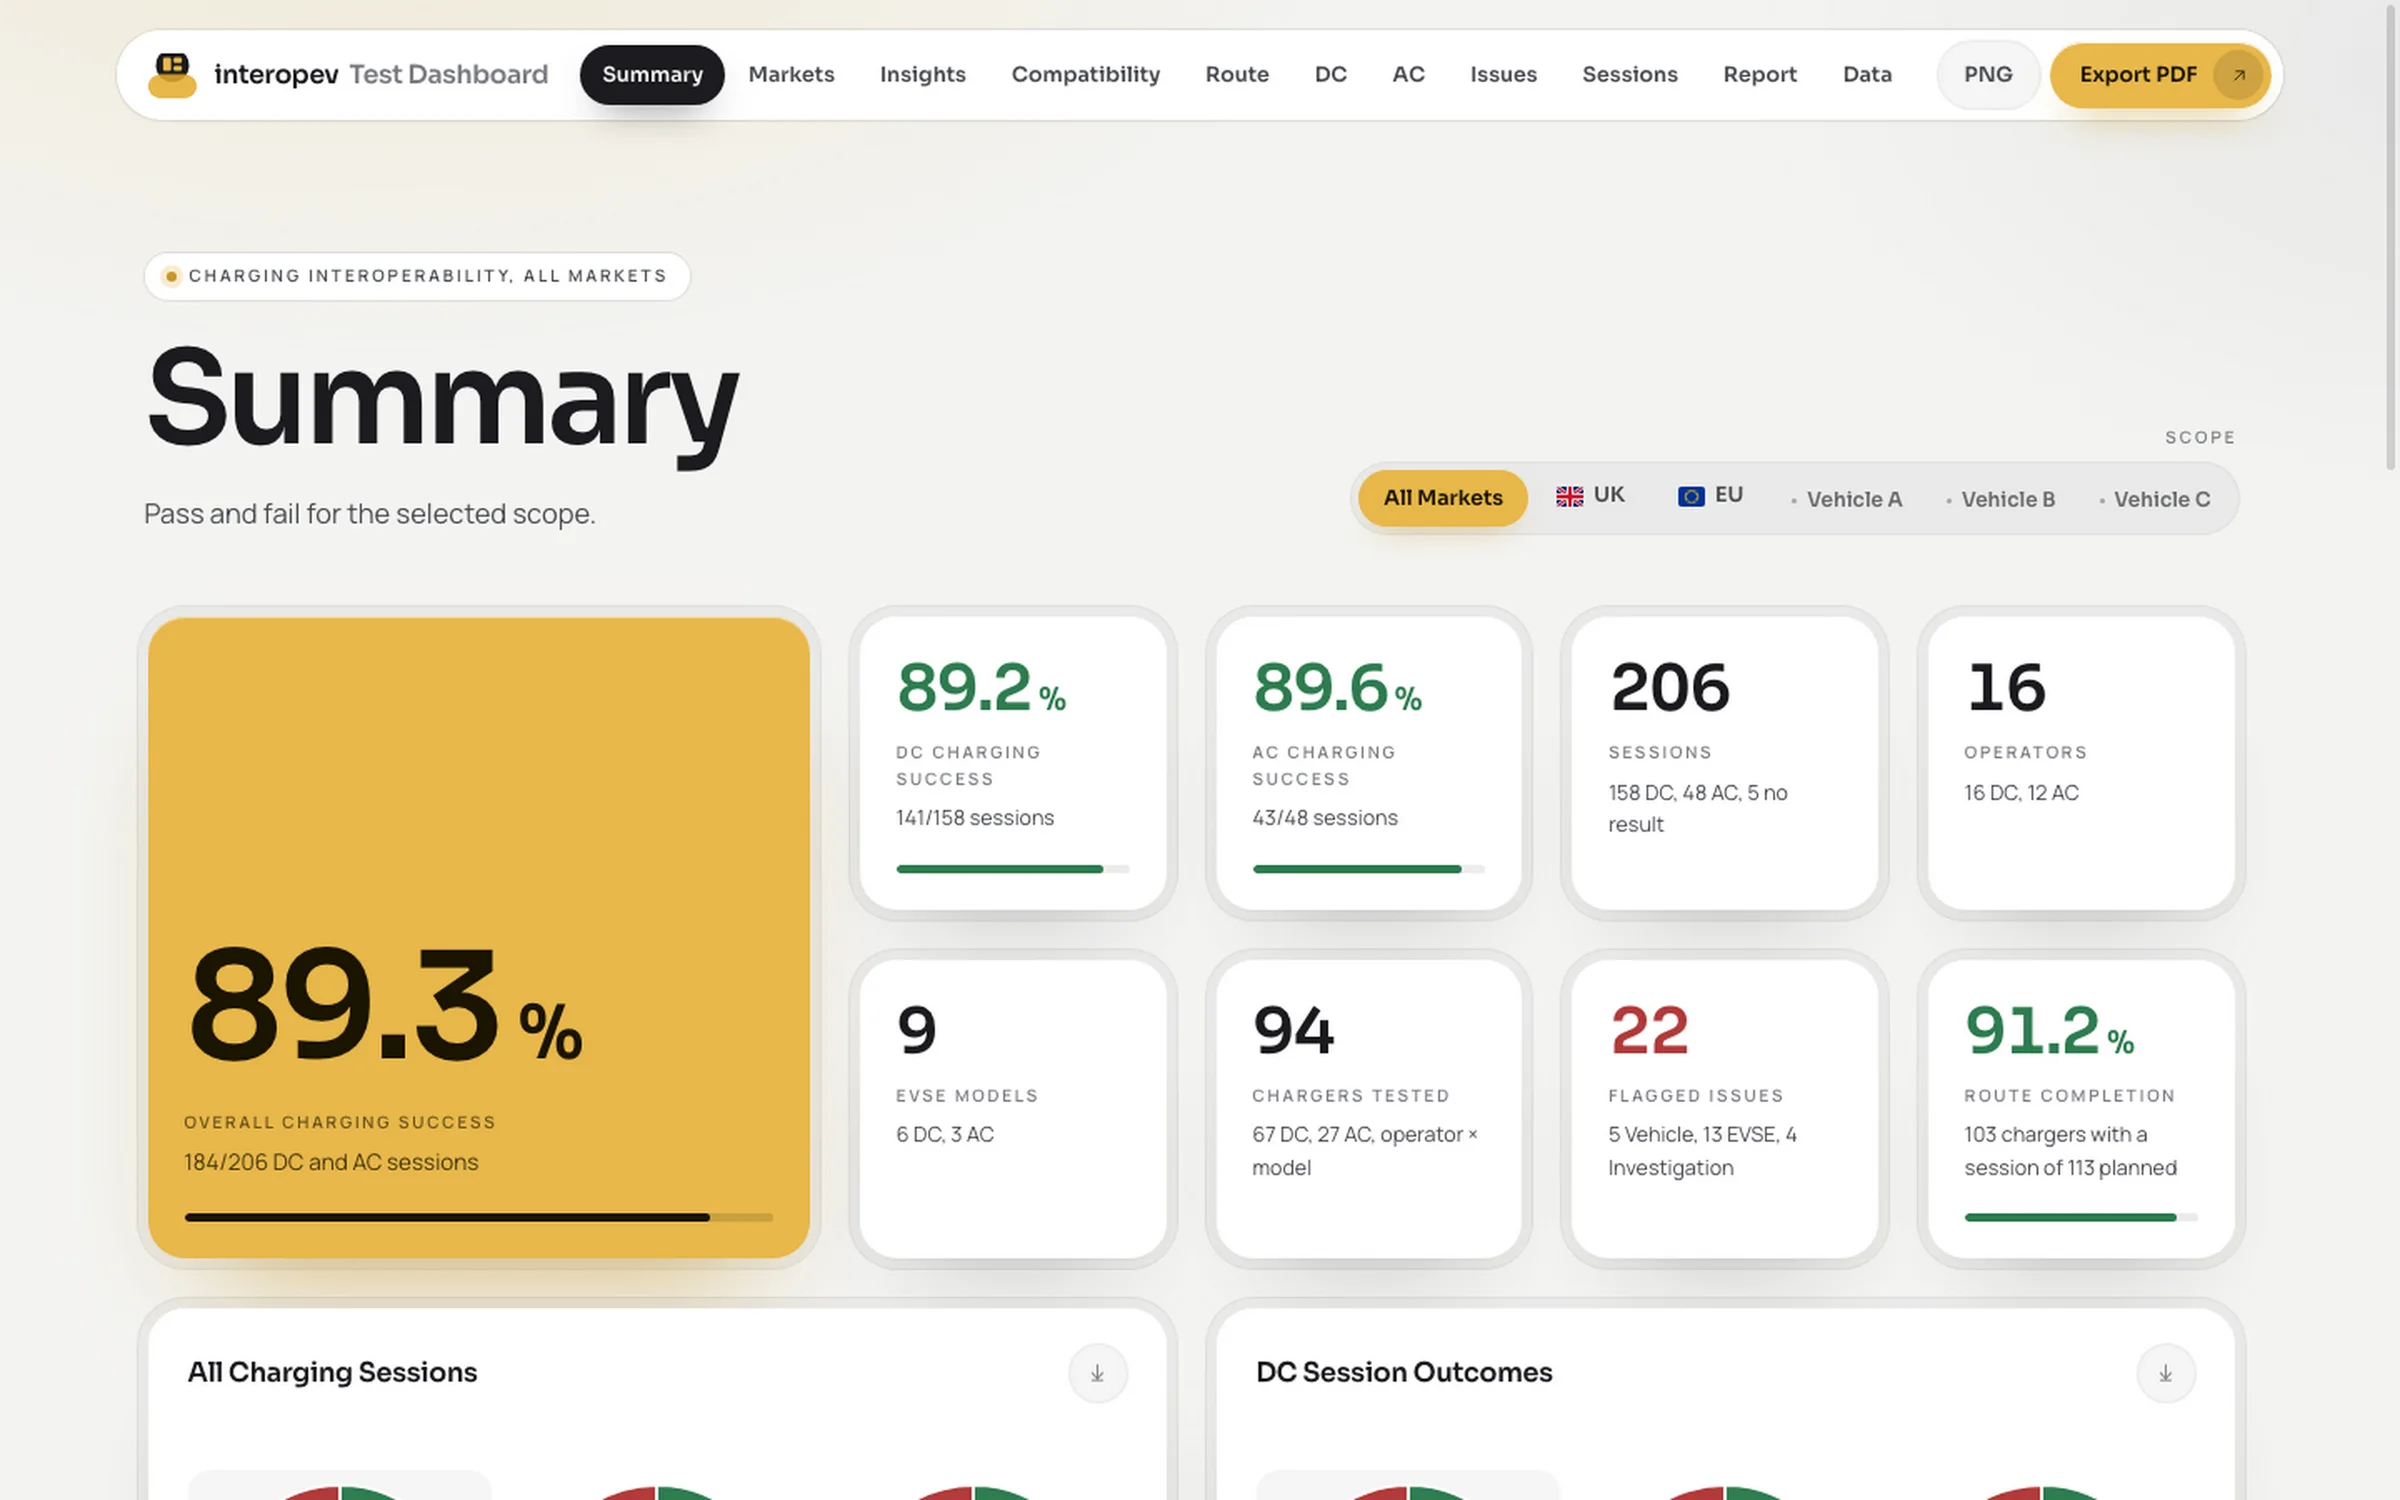
The state of the campaign, without the spreadsheet.
The dashboard is built from the test team's own workbooks, so the figures in the review are the figures in the field notes.
Pass rates by scope
Overall, DC and AC charging success for the programme, a market or a single vehicle, with the sessions behind every figure.
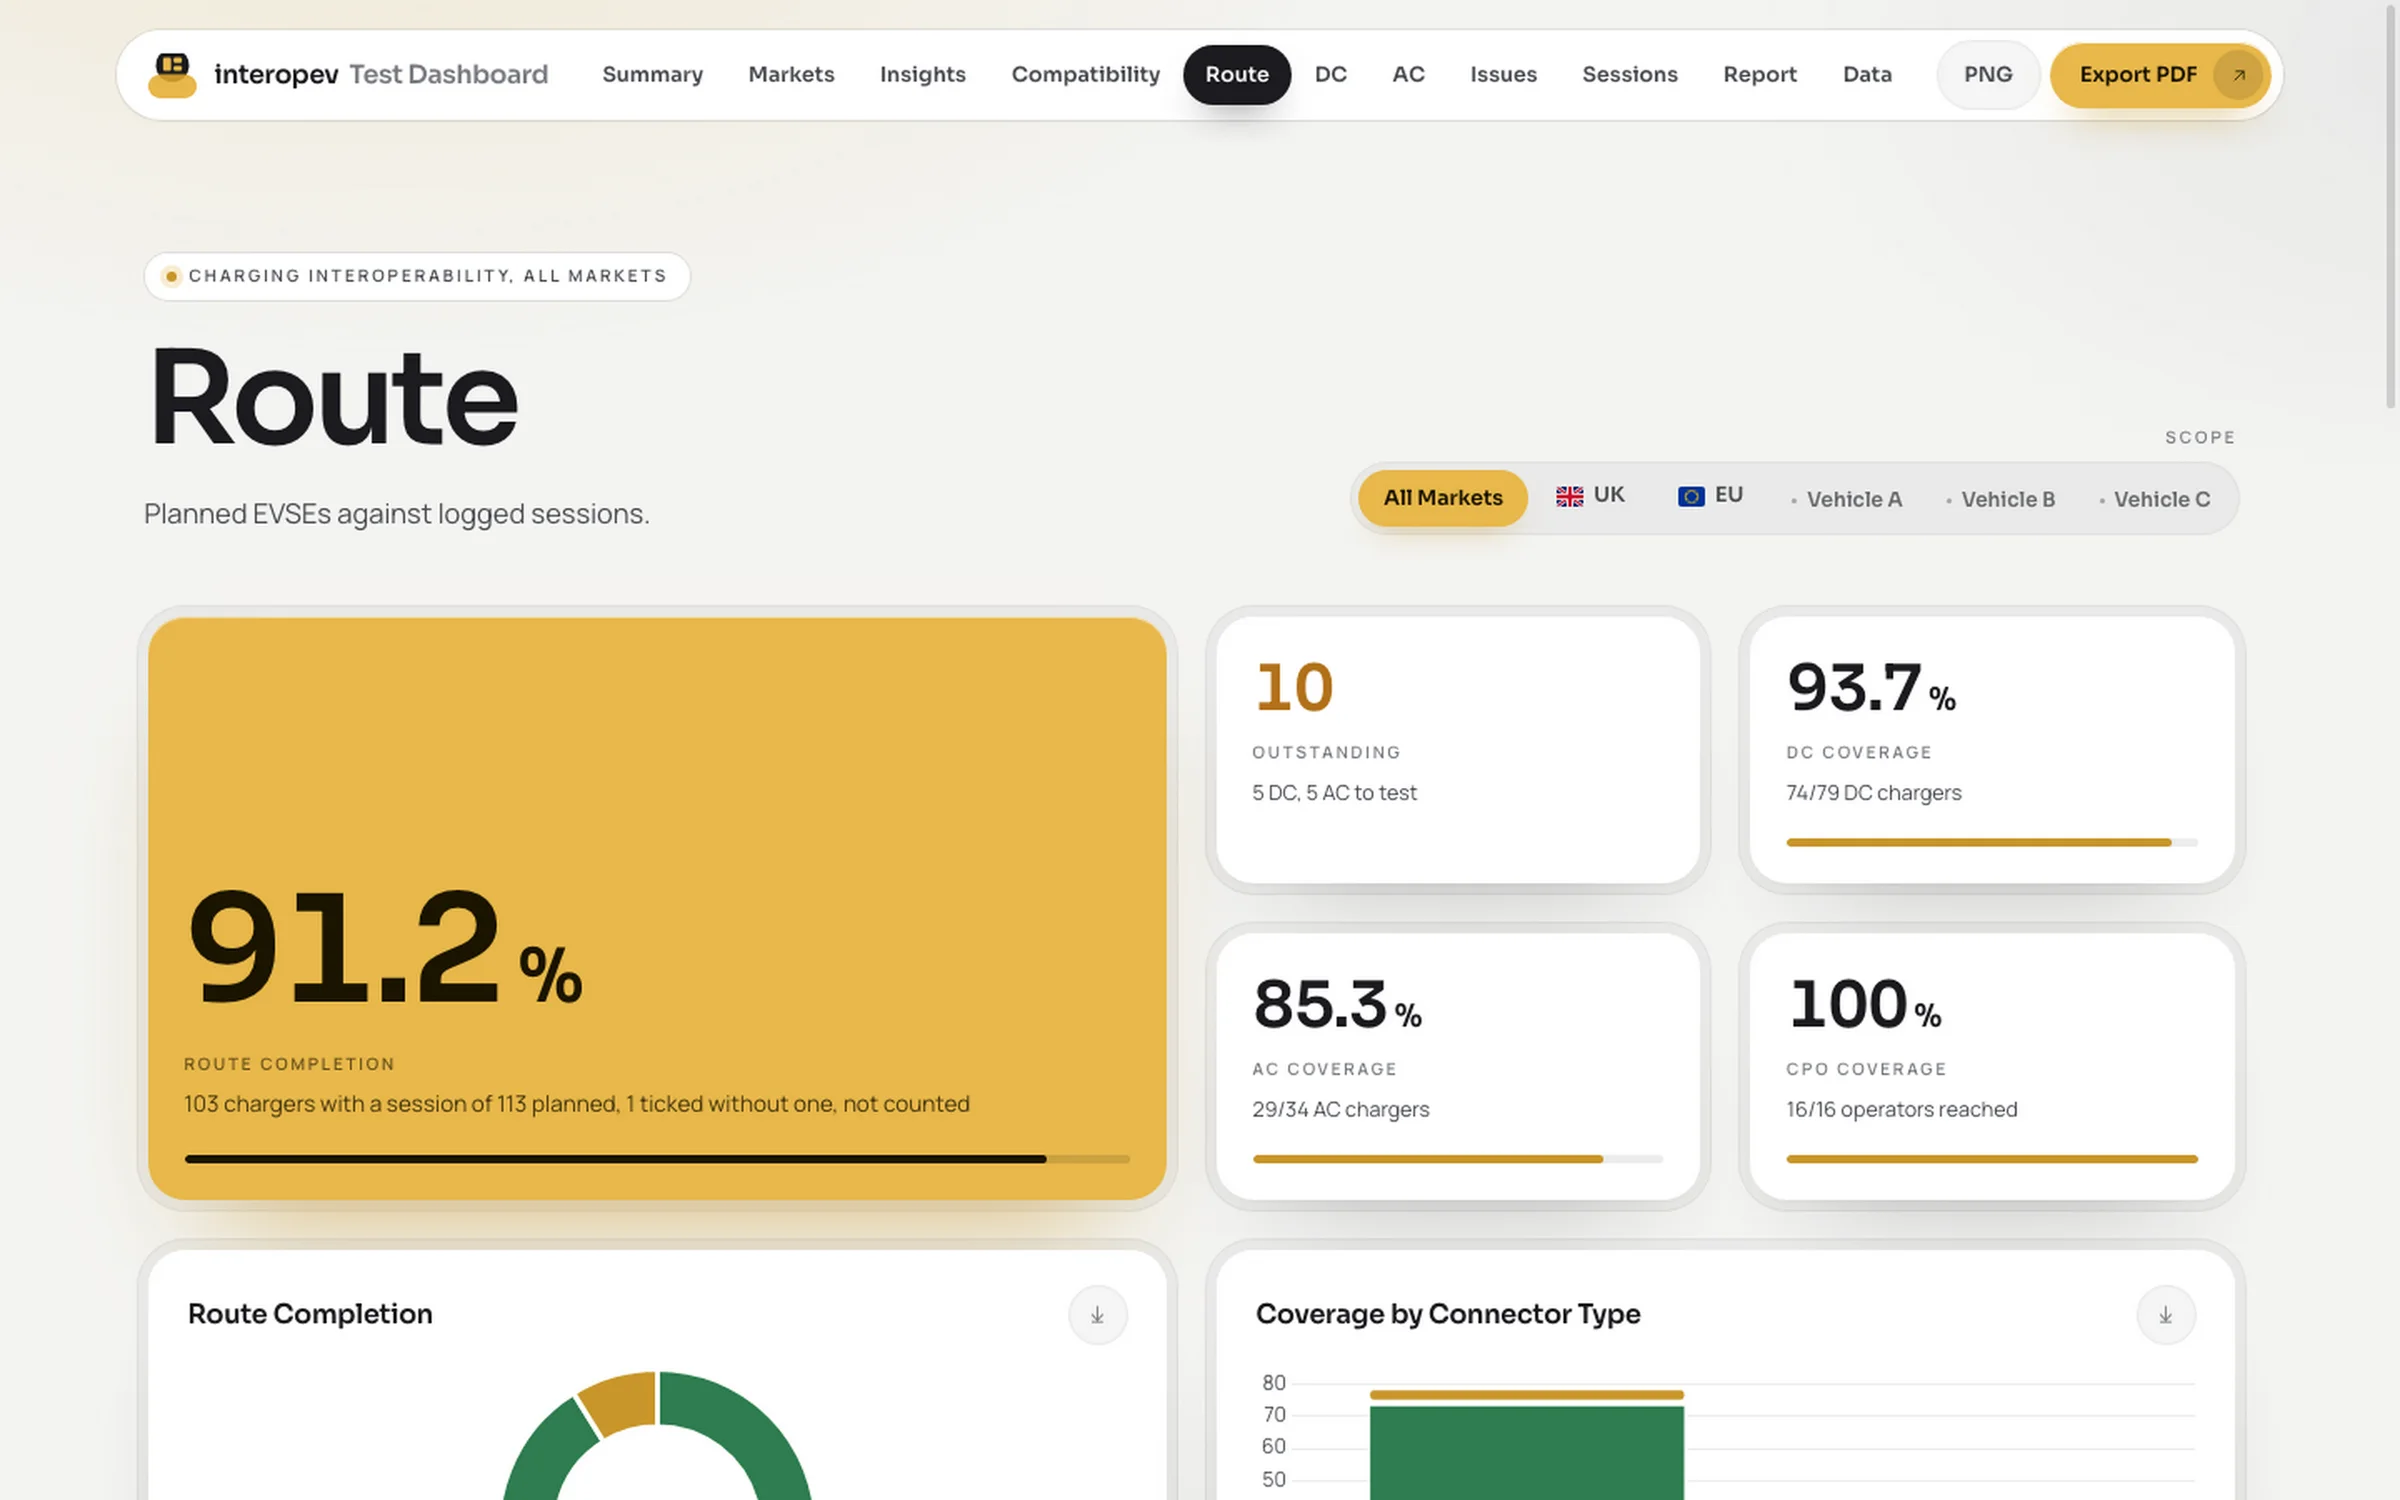
Route coverage
Planned chargers against logged sessions: what has been reached, what is outstanding, and which operators are covered.
Compatibility
Operators and charger models tested, with pass rates per market, so a weak combination shows up as a row, not an anecdote.
Issues by owner
Flagged issues split between vehicle, charger and those still under investigation, with the point in the session where each one stopped.
Every session
The full session log, searchable by operator, charger and protocol, filtered by outcome.
Report and snapshot
A print-ready report, and a single file that carries the dashboard and its data to someone who was not on the road.
Know what is left to drive.
The route plan and the session log are read together, so coverage is counted from what was tested and not from what was ticked.
- Completion for the whole route, and for DC and AC separately
- Coverage by operator, against the chargers planned for each
- Chargers tested off the plan are reported, not hidden
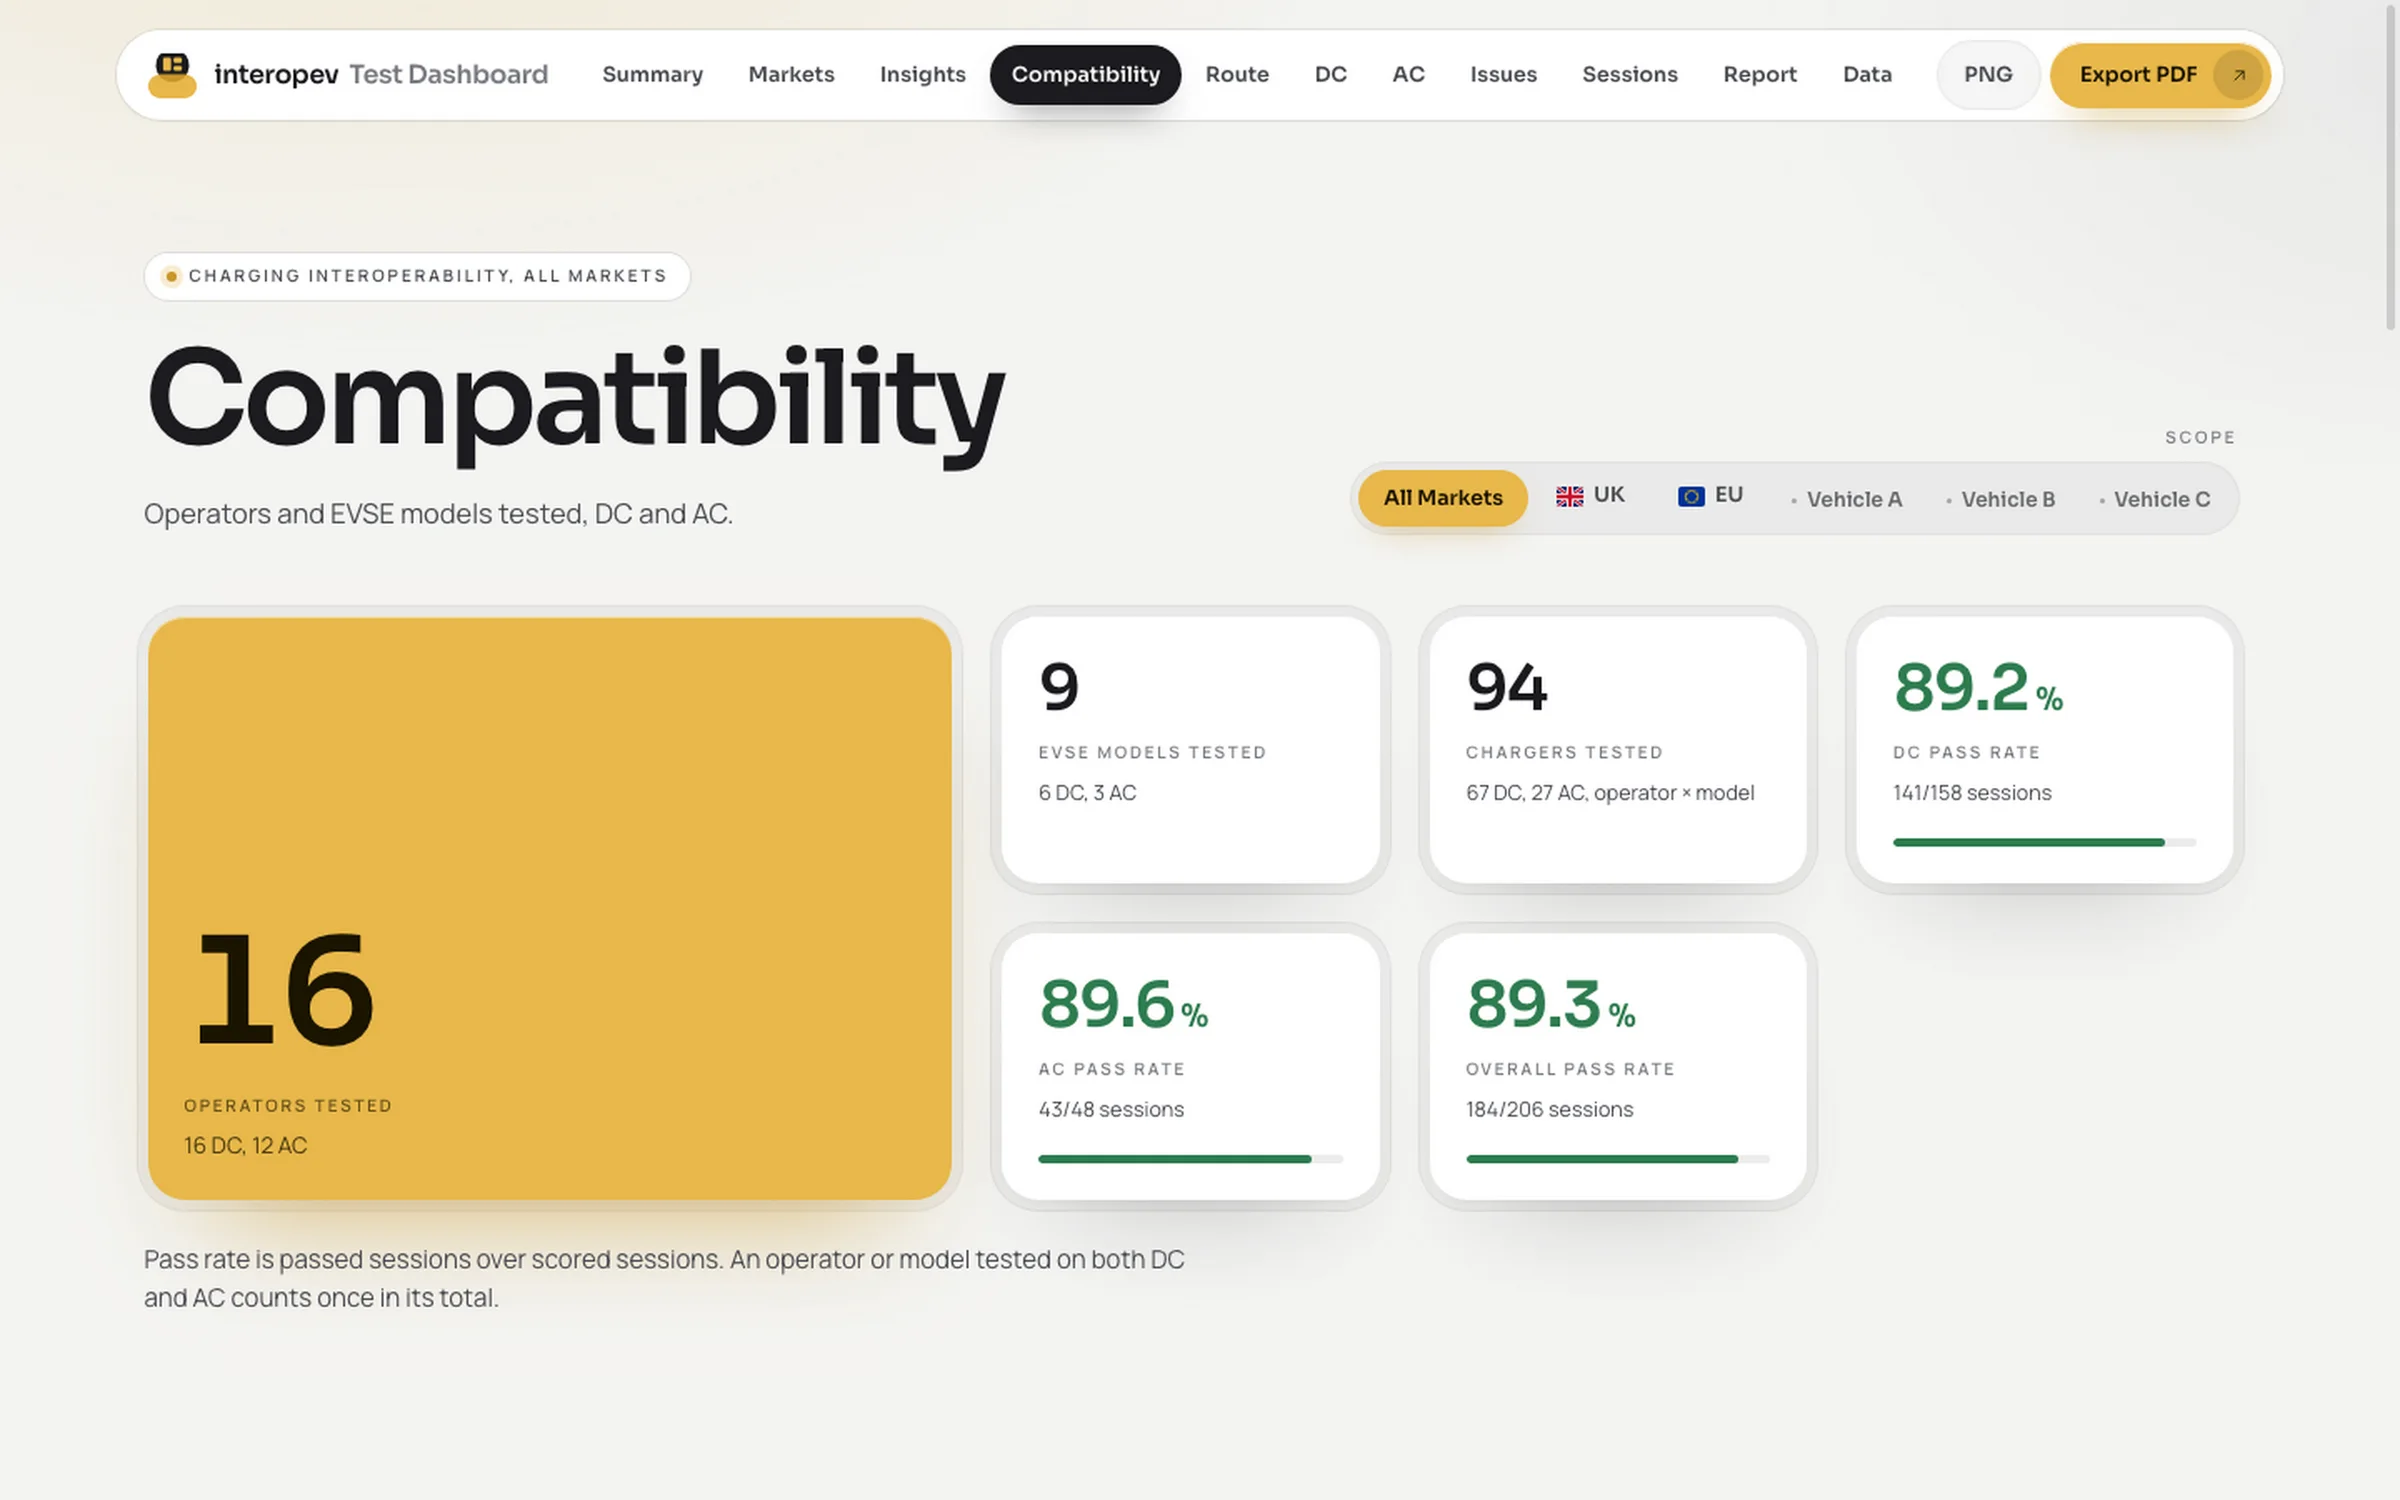
Which vehicle charges at which charger.
Coverage and pass rate for every market side by side, then operator by operator and model by model.
- Operators, charger models and chargers tested, DC and AC
- Pass rate is passed sessions over scored sessions, stated on the page
- The same view for one market or one vehicle
One step of a field campaign.
The dashboard is step four of six. We run the other five as well.
Market analysis
Which operators and charger platforms your drivers will meet, market by market.
Route planning
Sites chosen to cover the target platforms and operators in the fewest days on the road.
Test execution
Engineers on site with your vehicles. Every session is captured, whether it passes or fails.
Dashboards
Campaign status as it runs: pass rates, route coverage and open issues, by market and by vehicle.
Issue analysis
Root cause for each failure, the responsible side named, and recurring issues grouped.
Delivery
A final report, an issue list with owners, and a retest plan for the next software drop.
The screens on this page show example data.
Planning a test campaign?
Tell us the vehicles and the markets. We reply within one business day with a proposed approach.